C:\Users\Administrator\Desktop\hsqldb-2.3.2\data>netstat -h
Displays protocol statistics and current TCP/IP network connections.
NETSTAT [-a] [-b] [-e] [-f] [-n] [-o] [-p proto] [-r] [-s] [-t] [interval]
-a Displays all connections and listening ports.显示所有的连接和监听的端口
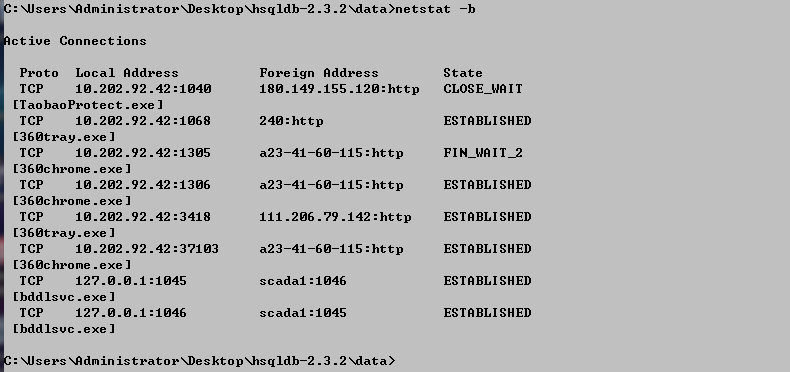
-b Displays the executable(可执行文件) involved in creating each connection or listening port. 显示用于创建每个连接或端口的可执行文件
In some cases well-known executables host multiple independent components, 有些情况下,某些知名的可执行文件与多个独立的组件相关
and in these cases the sequence of components involved in creating the connection or listening port is displayed.
In this case the executable name is in [] at the bottom,
on top is the component it called,
and so forth until TCP/IP was reached.
Note that this option can be time-consuming and will fail unless you have sufficient permissions.
-e Displays Ethernet statistics. This may be combined with the -s option.

-f Displays Fully Qualified Domain Names (FQDN) for foreign addresses.
-n Displays addresses and port numbers in numerical form.
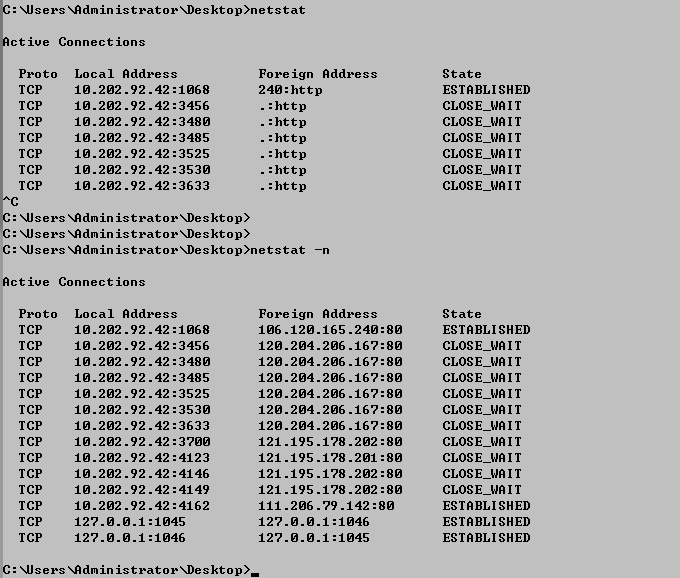
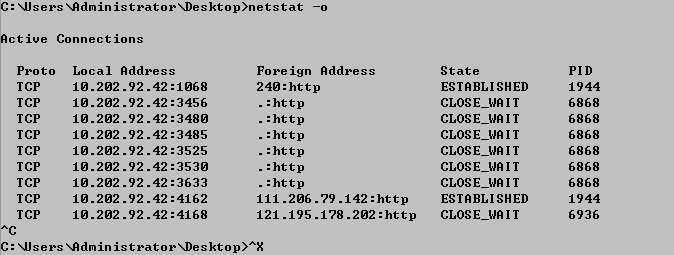
-o Displays the owning process ID associated with each connection. 显示每个连接关联的进程ID
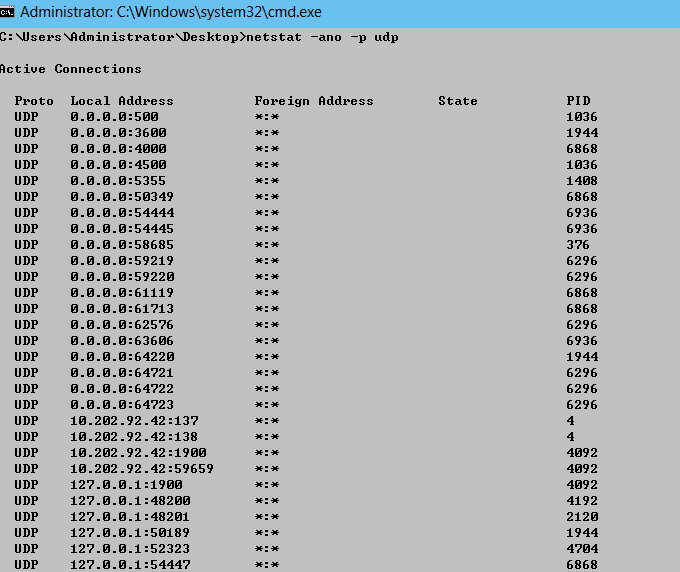
-p proto Shows connections for the protocol specified by proto; proto may be any of: TCP, UDP, TCPv6, or UDPv6.
显示指定协议的连接
If used with the -s option to display per-protocol statistics,
proto may be any of:IP, IPv6, ICMP, ICMPv6, TCP, TCPv6, UDP, or UDPv6.
-r Displays the routing table. 显示路由表
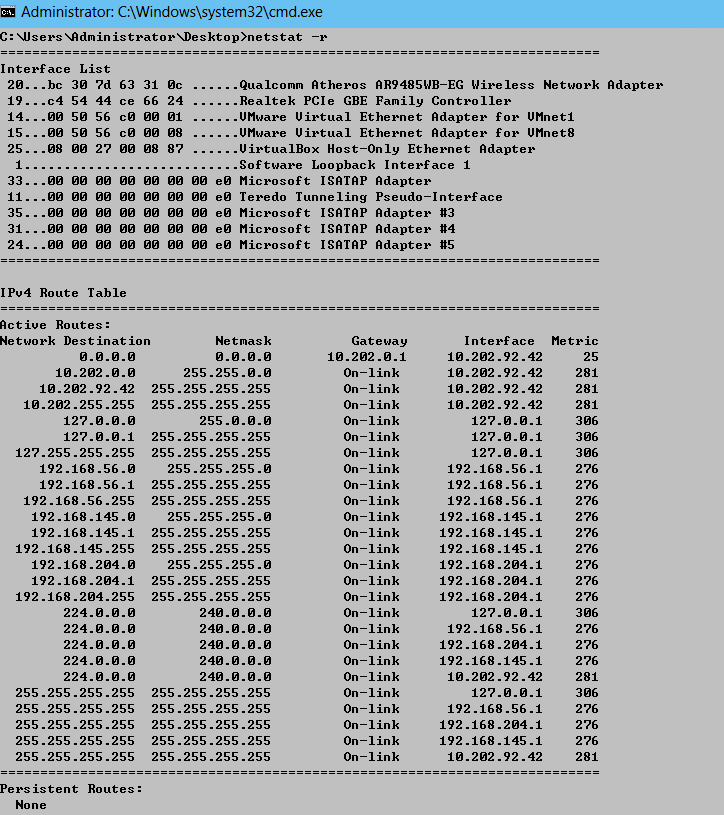
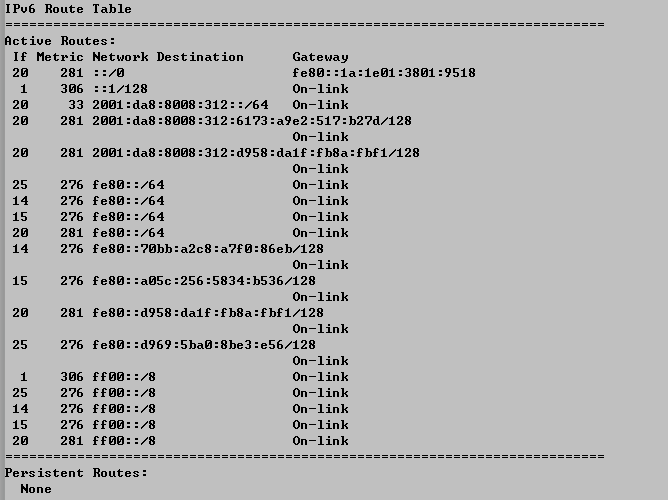
-s Displays per-protocol statistics. 显示每个协议的统计数据
By default, statistics are shown for IP, IPv6, ICMP, ICMPv6, TCP, TCPv6, UDP, and UDPv6;
the -p option may be used to specify a subset of the default.
-t Displays the current connection offload state.显示当前连接的卸载状态

interval Redisplays selected statistics, pausing interval seconds between each display.
指定间隔多少秒,重新显示统计数据,不指定仅显示一次
Press CTRL+C to stop redisplaying statistics.
If omitted, netstat will print the current configuration information once.